Understand your Monthly Report

Since May 2018, Voltaware has been delivering a monthly appliance-level breakdown detailing the electricity cost by individual appliance or appliance family...
The appliance categories
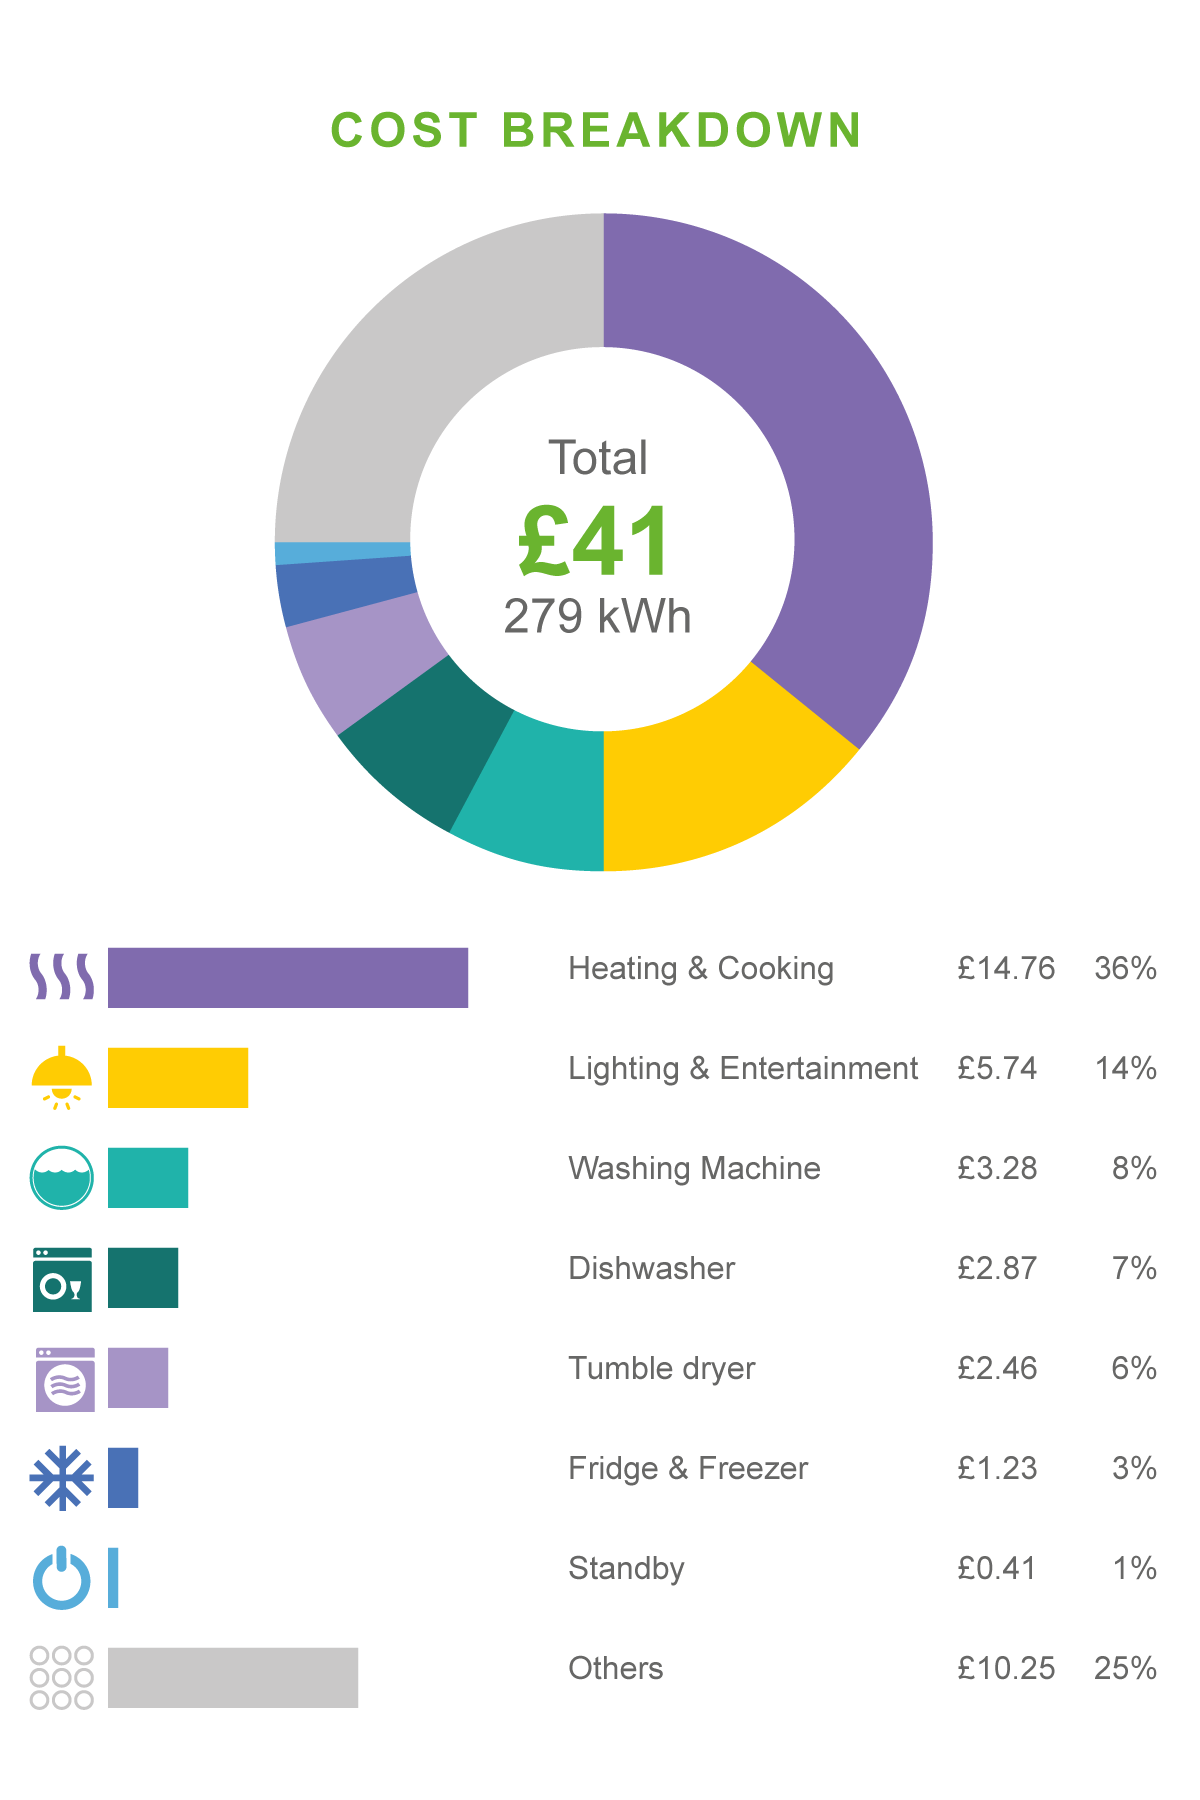
Since May 2018, Voltaware has been delivering a monthly appliance-level breakdown detailing the electricity cost by individual appliance or appliance family:
- Standby (these are the appliances that run all day long in standby mode),
- Fridge & Freezer,
- Lighting & Entertainment (lights, computers, TVs, etc.),
- Washing,
- Heating & Cooking (the most common appliances to fall in this category are electric radiator, electric cooker, electric oven, electric boiler. In fact, this category contains the purely resistive appliances of the house),
- Others (usually contains microwave, tumble dryer, hair dryer, air conditioner, vacuum cleaner).
For users who have completed the questionnaire as part of their monthly report, we will be able to provide a refined breakdown including appliances such as:
- Washing Machine
- Dishwasher
- Electric Shower
- Electric Boiler
- Tumble Dryer
House conditions
- Always on describes the condition the house is in for those appliances that run 24 hours a day. In most cases these appliances are those in standby mode and the fridge or freezer.
- Normal details the condition the house is in when some appliances with moderate consumption are switched on.
- Busy defines the condition the house is in when the appliances with the highest power draw are switched on.
How does it work?
Voltaware proposes a single sensor solution to increase transparency on electricity bills. The Voltaware sensor is placed in the fuse box and sends electrical data to the cloud in real time.
In a household, each electrical appliance has a unique fingerprint that is collected by the sensor. At regular intervals, Voltaware’s machine learning algorithms use these fingerprints to break down the electricity consumption into categories of appliances.
Voltaware’s mobile app is connected to hundreds of electricity providers’ tariffs in the world. This is how the consumption per category is accurately converted into the cost per category.
Precision
To evaluate the performance of the machine learning algorithms, Voltaware has built a testing environment consisting of several houses around the world in which the consumption of key appliances is recorded.
The issue of breaking down the electricity consumption is very hard to solve as each house has different appliances and each appliance fingerprint can vary from one model to another. Therefore, the performance of the algorithms declines as the number of appliances in the house increases. The use of some particular appliances also worsens the performance of the algorithms.
Results obtained from our testing environment show that the appliance breakdown has a +/- 1% precision rate in more than 90% of households with up to four people.
The following factors can degrade the performance of the algorithm:
- Multiple fridges or multiple washing machines in the same house
- More than 4 electrical radiators
- Big computers or servers
Next improvements
Voltaware’s data science team applies cutting edge techniques to solve the complex problem of bringing transparency to electricity bills.
Voltaware’s testing environment is growing constantly, and the data science team discovers more and more improvements for the existing appliance models and for the appliance category breakdown. These improvements are used every month to update the machine learning algorithms and to improve the precision of the report delivered to Voltaware’s users.
Please don’t forget to fill out the attached form linked to your monthly report so we can keep on improving our results and provide you with the best possible product.


